
When an employee says “the system is slow,” the cause may not lie in a single component. The laptop may be short on memory, the wireless network may be experiencing packet loss, the authentication service may be delayed, or a back-end dependency of the application may be slow. A traditional support model checks these layers one by one after the user reports the problem. The result is a long diagnosis process, tickets passed between teams, and the same problem recurring for different users.
An AIOps and digital employee experience approach aims to reverse this flow. It first measures the experience, collects the relevant technical signals in a shared context, prioritizes the likely cause, and, where appropriate, starts corrective action before the user is affected. This turns support from a reactive queue into a measurable service-improvement cycle.
What are AIOps and digital employee experience?
AIOps stands for Artificial Intelligence for IT Operations. Its purpose is to correlate large volumes of operational data using statistical methods and machine learning so that anomalies, recurring patterns, and probable root causes can be identified more quickly. This does not mean handing every decision over to artificial intelligence.
Digital employee experience focuses on how consistently an employee can complete a task through devices, networks, identity services, virtual desktops, and business applications. When the two approaches are combined, technical health indicators are tied to the question, “Can the employee get the job done?”
Measure the user journey, not just the component
A running server does not necessarily mean a good service. A payroll application, for example, may be reachable while sign-in takes 40 seconds, the reporting screen times out at a particular branch, or a new software release crashes on older devices. Monitoring must therefore extend beyond device processor utilization or network latency.
Start by defining critical journeys, such as starting the workday and signing in, connecting to a virtual private network (VPN), joining a video meeting, or completing a transaction in a business application. Alongside technical signals, monitor the success rate, waiting time, and affected user group for each journey.
A sound foundation: Shared, contextual telemetry
Telemetry is the measurement and event data that systems produce while operating. OpenTelemetry defines traces, metrics, logs, and baggage, which carries context across these signals, as supported signals. A metric records a measurement at a point in time, a log records an event, and a trace shows the path of a request across components. Adding endpoint health, Wi-Fi quality, identity events, and change records to the same timeline creates end-to-end visibility instead of a collection of isolated screens.
The value of data comes from context, not volume. Device, user group, location, application version, service owner, and recent change data should be linked through a common asset model. The collection layer should reduce dependence on a single vendor. It should also avoid unnecessary personal data and define retention periods and access rights clearly.

Moving from noise to root cause
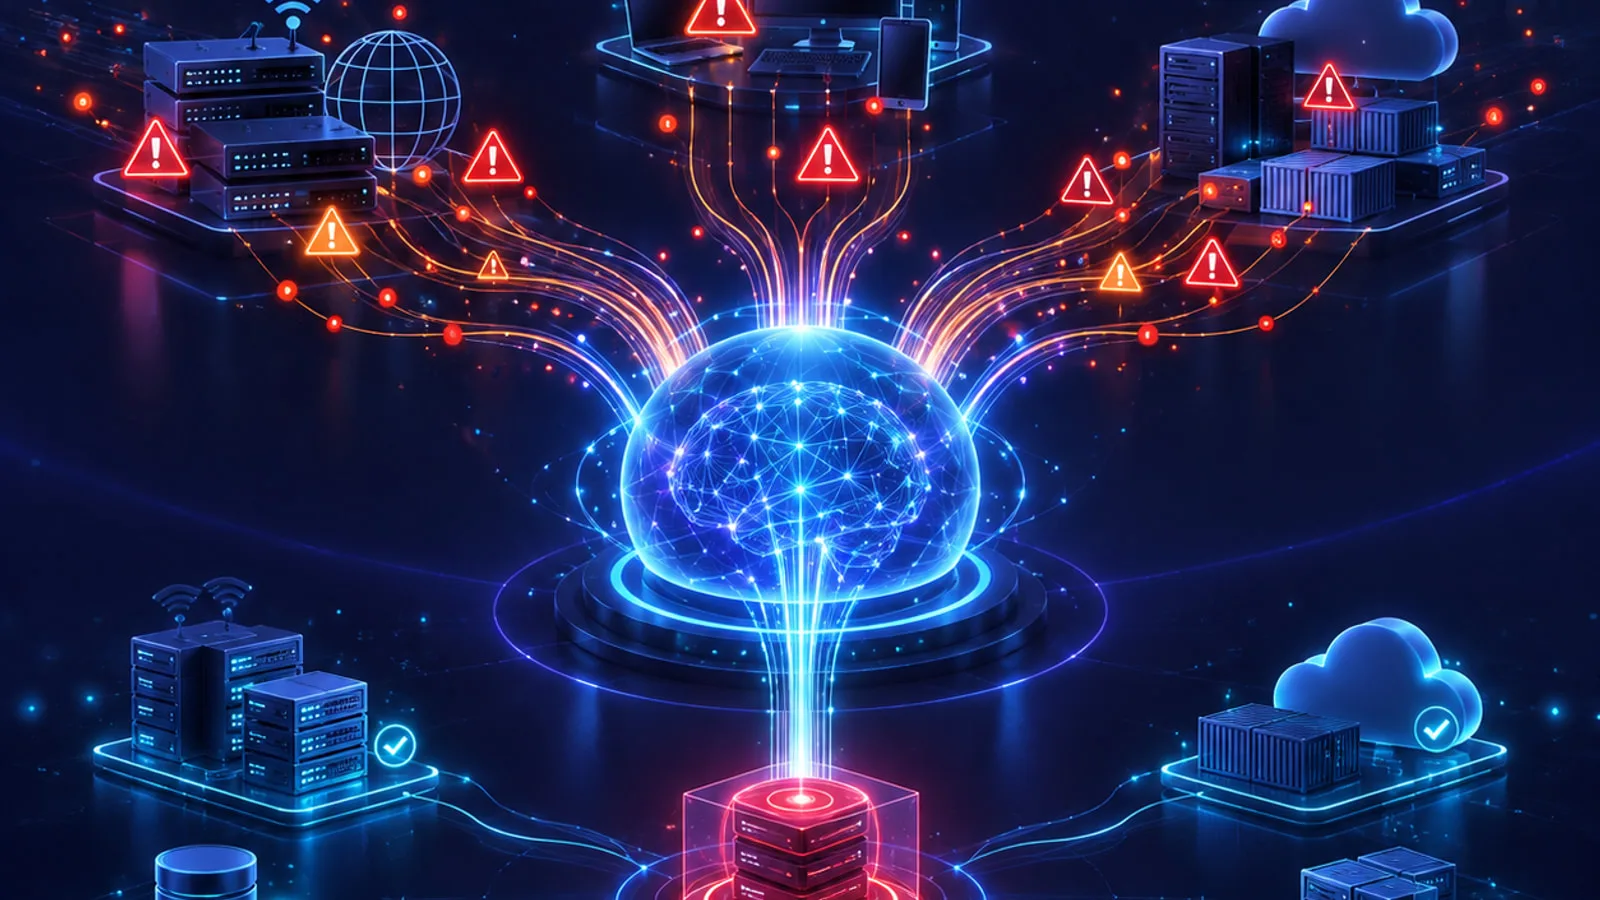
An outage may generate hundreds of threshold alerts, but many of them are symptoms of the same event. The AIOps layer can evaluate timing, shared dependencies, change history, and the affected user group together, then consolidate related alerts into a single incident record. The team can then ask “Which change disrupted which journey?” instead of “Which alert should I close?”
Static thresholds are not enough on their own. Monday morning sign-in volume and the normal load for a night shift are different. Baselines should account for seasonality and location. Even so, a model output should be treated as a hypothesis to investigate, not as proof. A root-cause suggestion becomes useful to an operations team when it can be explained through the related trace, log, version, and change record.
Automation boundaries and human oversight
Low-risk, reversible actions are suitable starting points. Examples include clearing a cache, restarting a failed service, removing temporary files that can be deleted safely, or giving the user a verified self-service step. Every automation should have documented trigger conditions, scope, success criteria, timeout, and rollback plan.
High-impact actions, such as changing an identity policy, removing software from many devices, or rerouting production traffic, should pass through an approval gate. The NIST AI Risk Management Framework emphasizes defining the roles of continuous monitoring and human oversight in AI systems. The rate at which the model flags a problem that does not exist (a false positive) or misses a real problem (a false negative) should be measured regularly. Automation should be stoppable when drift is detected.

Common mistakes
The first mistake is moving all available data to one platform before defining a use case. This often produces an expensive data lake and more alerts. The second is measuring success only by the number of support tickets closed. The user experience may deteriorate even while ticket volume falls. Journey success rate, number of affected users, and detection and resolution times should be monitored together.
Other mistakes include applying the same baseline to every location, failing to maintain the asset inventory, being unable to explain model decisions, and running irreversible automation. Employee telemetry must not become a surveillance tool. Its purpose is to measure service quality, not evaluate individuals.
Sector use cases
In manufacturing, issues with shared terminals and wireless handheld devices at the start of a shift can be monitored alongside their effect on production applications. In retail, store-network, point-of-sale (POS), and inventory-terminal signals can be correlated by location to detect a regional outage early. In logistics, roaming and Wi-Fi handoff problems affecting handheld terminals can be tied to the delivery process.
Financial institutions can measure branch devices, secure access, and a core business application as one journey. In healthcare, sign-in and application response times can be monitored on clinical workstations while privacy and access controls remain especially strict. The common principle is to tie the technical metric directly to a business step.
A phased implementation roadmap
In the first phase, select no more than three critical employee journeys and establish a baseline from existing support records. In the second phase, combine endpoint, network, identity, and application telemetry using a shared time and asset model. Do not start modeling until data quality has been validated.
In the third phase, operate alert consolidation and root-cause suggestions as a human-approved pilot. In the fourth, automate only two or three frequently recurring, low-risk, reversible actions. In the final phase, extend the scope to new journeys and have the governance board review model accuracy, user impact, cost, and privacy controls regularly.
Where to start: A short checklist
· Are the three most critical employee journeys and their service owners identified?
· Can endpoint, network, identity, and application data be correlated through a common timestamp and asset identifier?
· Do success measures show user impact as well as support-ticket volume?
· Are the scope, approval threshold, and rollback plan for automated actions defined?
· Is the purpose, access model, and retention period for collected data clear to employees and managers?
Sources
· OpenTelemetry — Signals (https://opentelemetry.io/docs/concepts/signals/)
· OpenTelemetry — Collector (https://opentelemetry.io/docs/collector/)
· NIST SP 800-137 — Information Security Continuous Monitoring (https://csrc.nist.gov/pubs/sp/800/137/final)
· NIST — Artificial Intelligence Risk Management Framework 1.0 (https://www.nist.gov/publications/artificial-intelligence-risk-management-framework-ai-rmf-10)
· CISA — Use Logging on Business Systems (https://www.cisa.gov/audiences/small-and-medium-businesses/secure-your-business/use-logging-on-business-systems)